Galápagos and Californian sea lions are separate species: Genetic analysis of the genus Zalophus and its implications for conservation management
Jochen BW Wolf1,2,3 , Diethard Tautz1 and Fritz Trillmich3
1Department of Evolution Genetics, Institute for Genetics, University of Köln, Zülpicherstraße 47, 50674 Köln, Germany
2Max-Planck Institute of Evolutionary Biology, August-Thienemannstr. 2, 24306 Plön, Germany
3Department of Animal Behaviour; University of Bielefeld; PO Box 10 01 31; 33501 Bielefeld; Germany
Frontiers in Zoology 2007, 4:20doi:10.1186/1742-9994-4-20
The electronic version of this article is the complete one and can be found online at:
www.frontiersinzoology.com/content/4/1/20Received: 24 June 2007
Accepted: 15 September 2007
Published: 15 September 2007
© 2007 Wolf et al; licensee BioMed Central Ltd.
This is an Open Access article distributed under the terms of the Creative Commons Attribution License (http://creativecommons.org/licenses/by/2.0), which permits unrestricted use, distribution, and reproduction in any medium, provided the original work is properly cited.
Abstract
Background
Accurate formal taxonomic designations are thought to be of critical importance for the conservation of endangered taxa. The Galápagos sea lion (GSL), being appreciated as a key element of the Galápagos marine ecosystem, has lately been listed as 'vulnerable' by the IUCN. To date there is, however, hardly any scientific evidence, whether it constitutes a separate entity from its abundant Californian neighbour (CSL).
In this paper, we delineate the taxonomic relationships within the genus Zalophus being comprised of the Galápagos sea lion, the Californian sea lion and the already extinct Japanese sea lion (JSL).Results
Using a set of different phylogenetic reconstruction approaches, we find support for monophyly of all three taxa without evidence of reticulation events. Molecular clock estimates place time to common ancestry of the Galápagos sea lion and the Californian sea lion at about 2.3 ± 0.5 mya. Genetic separation is further suggested by diagnostic SNPs in the mitochondrial and nuclear genome. Microsatellite markers confirm this trend, showing numerous private alleles at most of the 25 investigated loci. Microsatellite-based estimates of genetic differentiation between the Galápagos sea lion and the Californian sea lion indicate significant genetic differentiation. Gene diversity is 14% lower in the Galápagos sea lion than in the Californian sea lion, but there is no evidence for recent bottleneck events in the Galápagos sea lion.
Conclusion
Based on molecular evidence we build a case for classifying the Galápagos sea lion (Zalophus wollebaeki), the Californian sea lion (Zalophus californianus) and the Japanese sea lion (Zalophus japonicus) as true species. As morphological characters do not necessarily fully reflect the rapid divergence on the molecular level, the study can be considered as a test case for deriving species status from molecular evidence. We further use the results to discuss the role of genetics in conservation policy for an organism that already is under the general protection of the habitat it lives in.Background
Conservation effort is directed to biological units that can largely differ in scale ranging from a single target species to entire biocoenoses. It is nonetheless believed to be imperative in all cases that the conservation unit of interest ought to be operationally defined. On the level of single species, the concept of evolutionary significant units (ESU) has successfully been implemented to determine population units that merit separate conservation management [see [1]]. However, even in long-managed populations ecological, geographical and genetic borders, core to the ESU concept, are not always clearly delineated. This is well illustrated in the case of the endemic Galápagos sea lion, whose geographical range is well defined (Fig. 1), while it is unclear if it constitutes a unique ecological and evolutionary entity.
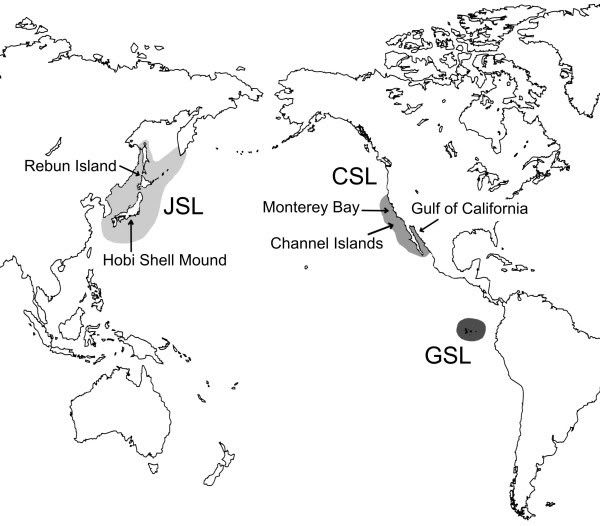
Figure 1. Map of distribution for three taxa in the genus Zalophus. Breeding range of the Galápagos sea lion (GSL), the Californian sea lion (CSL), and putative distribution of the extinct Japanese sea lion (JSL). Modified after Heath [10] and Rice [20]. Arrows indicate sampling material used in this study.
The Galápagos sea lion is one of the most conspicuous marine organisms of the Galápagos archipelago. Not only does it play a central role as a key predator in the Galápagos marine ecosystem. With its playful behaviour and friendly appearance it engages the sympathy of thousands of national and international visitors year by year and constitutes a keystone reference for the preservation of marine resources in the Galápagos Islands. As other marine organisms in the Galápagos it deserves special attention from a conservation viewpoint, being subject to extreme changes in food availability triggered by climatic fluctuations of the El Niño Southern Oscillation events. During such an event, mortality drastically increases and can lead to the loss of entire cohorts [2]. Population recovery may be increasingly hampered by human activities, in particular by the increasing depletion of marine resources, often in disrespect of existing regulations [[3], see also [4]]. While in the early 1960s its population was estimated at about 20.000 to 50.000 individuals and described as abundant [5,6], recent census results suggest that numbers have declined since the late 70s to approximately 14.000 individuals at present [7]. The 'IUCN Red List of Threatened Species™', which classifies species at high risk of global extinction, has categorized it as 'vulnerable' in 1996 [8]. In contrast, the Californian sister population has experienced steady growth over the last three decades [9] reaching numbers of 167.000–188.00 with a yearly pup production of about 33.000 [10]. It is classified at 'lower risk with least concern'.
The JSL is considered extinct; the last credible reports date back to the late 1950s.The taxonomic status within the three allopatric taxa of the genus Zalophus that so markedly differ in the degree of threat is contentious and inconsistently treated by the scientific community. Originally, the GSL has been described as a new species, Zalophus wollebaeki [11], but was soon relegated to sub-species level by Scheffer [12]. A representative screen of several citation databases illustrates this taxonomic uncertainty, as all of the three taxa have been treated as both subspecies and full species until today [e.g. [13,14]]. In pinniped phylogenies, the existence of the GSL is usually ignored [15,16]. Marine mammal encyclopaedias also differ in their viewpoint without specifying the reasons for their decision [10,17-20].
The aim we pursue in this study is twofold. In a first step, we address the taxonomic relationships within the three taxa of the genus Zalophus. We tackle the problem from the perspectives of both systematics and population biology, an approach that is more and more appreciated to confront species uncertainty in conservation [21]. The former will help to clarify the existence of characters that are shared uniquely among the specimens assigned to one taxon, and allows delineation in a purely taxonomic sense. The inclusion of the taxa into the broader phylogenetic context of all otariid species will further help to estimate genetic divergence, the degree of reproductive and historical isolation and will also contribute to a better understanding of pinniped phylogeny. The latter approach based on population genetics, describes evolutionary processes such as gene flow and helps to decide, whether it is justified to view the populations as separate evolutionary entities.
Second, we use our results to discuss the role of genetics in conservation policy for an organism that already is under the general protection of the nature reserve it lives in. We raise the question, whether better taxonomic classification is likely to affect conservation policy. We further address the important issue of genetic depauperation that can correlate with a population's resilience to introduced diseases.
Results
Mitochondrial DNA
Position of the GSL and the CLS within the otariid phylogeny
The phylogenetic reconstruction based on part of the mitochondrial control region and cytochrome b gene supports the major topological relationships within the otariid seals as suggested by Wynen and co-workers [15]. Sister group relationship of the two remnant Zalophus taxa is clearly exposed by both Bayesian and maximum parsimony analysis (Fig. 2). The Steller sea lion (Eumetopias jubatus) proves to be the neighbouring clade. A clear split between the CSL and GSL is supported by Bayesian analysis with maximum posterior probabilities for both clades (straight numbers Fig. 2). In the maximum parsimony bootstrap consensus, the GSL is still found to be monophyletic with high bootstrap support, while the Californian clade holds up with medium support (italic numbers Fig. 2). As the alignment with all otariid species compromises the resolution of the tree, we additionally estimated genetic divergence between the two Zalophus taxa separately making use of the entire available sequence information (1123 bp alignment). The number of fixed differences is considerably higher for the control region (9/623 bp) than for the cytochrome b gene (1/500 bp).
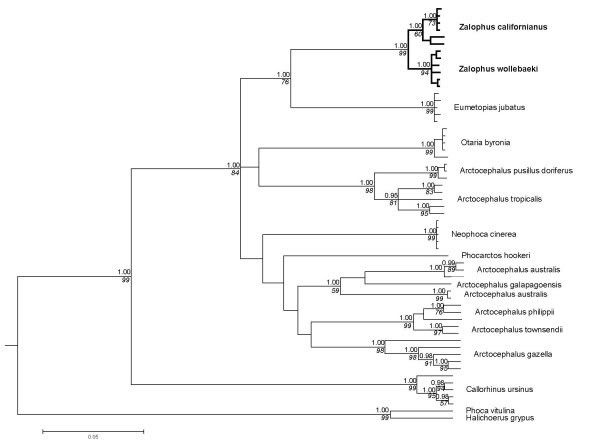
Figure 2. Phylogenetic relationships of otariid seals. 50 percent consensus cladogram of mitochondrial DNA (control region & cytochrome b) from 14 otariid and two phocid seal taxa. Posterior probability values (Bayesian clade credibilities, GTR + Γ + I model) are shown above with branches in non-italicised numbers and parsimony bootstrap support values below the nodes in italics (5000 replicates).
Molecular clock estimates are based on the Bayesian consensus tree, using the Phocina clade (Phoca vitulina and Halichoerus grypus) for calibration (see Methods). Minimum radiation time for the CSL and the GSL are estimated at 1.31 ± 0.43 mya and 0.58 ± 0.29 mya, respectively. Time to common ancestry of the Californian and the Galápagos sea lion is calculated to be in the range of 2.3 ± 0.5 mya.
Relationships within the genus Zalophus
To account for the fact that the observed split between the GSL and the CSL might be specific for the Monterey population used in the overall otariid tree, we conducted a detailed analysis on the genus Zalophus including sequences of the JSL and a broader sampling of CSL populations (see Methods). Although only a relatively short sequence is available for all these samples (301 bp) the Bayesian tree identifies all three taxa as monophyletic with reasonable posterior probabilities (Fig. 3). Within the CLS divergence is high and the population in the Gulf of California stands out as a possible unit of its own.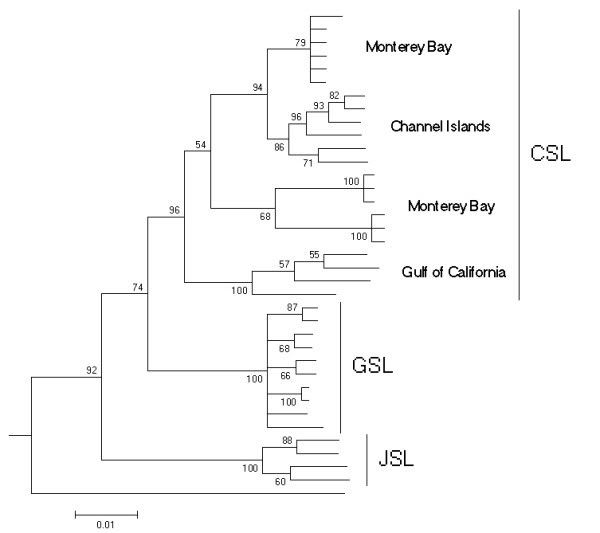 Figure 3. Detailed phylogenetic relationships within the genus Zalophus. Bayesian 50 percent consensus cladogram based on the mitochondrial control region depicting relationships within the genus Zalophus: Californian sea lion (CSL), Galápagos sea lion (GSL), Japanese sea lion (JSL). Posterior probability values (Bayesian clade credibilities) are shown for each node. The Steller sea lion (Eumetopias jubatus) has been used as the outgroup.
Phylogenetic network approaches reproduce the pattern without showing reticulation between the taxa (Fig. 4A,B). In the parsimony based median-joining algorithm (Fig. 4B) individuals from one taxon form particularly clear clusters. Again, divergence within the CSL is evident.
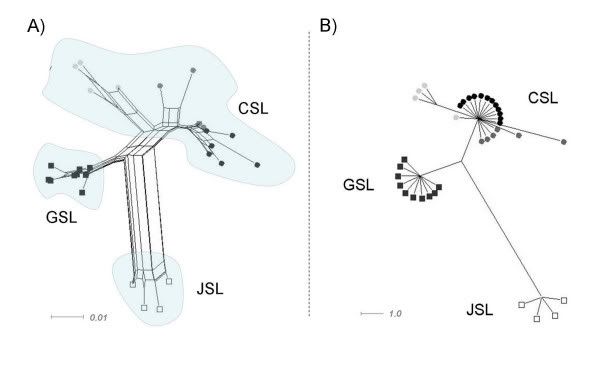 Figure 4. Phylogenetic networks of the genus Zalophus. Phylogenetic networks based on the mitochondrial control region showing relationships within the genus Zalophus: Californian sea lion (CSL), Galápagos sea lion (GSL), Japanese sea lion (JSL). Geographically different populations of the CSL are colour-coded: Gulf of California (light grey), Monterey Bay (dark grey), Channel Islands (black). A) Distance based network using the Neighbor-Net algorithm. B) Parsimony based median joining network shown for a minimum split weight of two.
Nuclear microsatellites
The mitochondrial evidence for monophyly of the CSL and the GSL is underpinned by markers of the nuclear genome. Both, the CSL and the GSL show numerous private alleles in 18 and 23 out of 25 microsatellite loci respectively (Table 1). Moreover, the two clades constitute separate population clusters in two Bayesian assignment approaches, assigning every single individual correctly with mean admixture proportions of 1.0000 in STRUCTURE and 0.9934 (± 0.0008SE) in BAPS pointing to a complete lack of exchange of individuals.
Table 1. Microsatellite loci. Summary of the 25 microsatellite loci used in this study and polymorphism characteristics for 1233 Galápagos sea lions (GSL) and 16 Californian sea lions (CSL).
Traditional population genetic measures also indicate a clear quantitative differentiation between the taxa far above random level (G-statistic: p < 0.001). All estimates of population differentiation are high, although they vary considerably. Estimators of Rst, taking allele size into account, are more than twice as high as Fst estimates based on the infinite allele assumption (SMM: Rst = 0.43; IAM: Gst' = 0.20; θ = 0.21 ± 0.03SE). This difference reflects bimodality in allele sizes and underlines the high number of private alleles in each taxon. Strongly differing sample sizes do not affect estimates of differentiation statistics. Population comparisons of CSL and ten random, equally sized sub-samples of the larger GSL database produce similar estimates (SMM: Rst = 0.40 ± 0.006; IAM: Gst' = 0.20 ± 0.002SE; θ = 0.20 ± 0.002SE). All ten comparisons indicate highly significant population differentiation, even when taking multiple testing into account. Overall, genetic distance between the CSL and GSL is an order of magnitude larger than within populations of the GSL (Rst = 0.010, Gst' = 0.009, θ = 0.009).
Nuclear SNPs
In addition to microsatellite markers, we screened 13 unlinked loci of the nuclear genome for single nucleotide polymorphisms using genomic DNA pools of 11 individuals for each population. Out of a total of 4606 bp, we find one diagnostic difference and four polymorphic sites that are fixed in only one taxon (last two columns of Table 2).
Table 2. Candidate loci of single nucleotide polymorphisms between the Galápagos and the Californian sea lion. Letters used for indicating variable sites correspond to the international ambiguity code. .
Genetic variation and bottleneck
Gene diversity is significantly lower in the GSL than in the CSL (mean over all loci: GSL 0.622 ± 0.035SE; CSL 0.720 ± 0.030SE, Wilcoxon-test: V = 49, p = 0.0118). Mean allelic richness is lower only in tendency in the GSL (GSL: 5.22 ± 0.41SE; CSL 6.04 ± 0.58SE; Wilcoxon-test: V = 69, p = 0.063). Random sub-sampling in the GSL confirms that gene diversity and allelic richness estimates are hardly influenced by differing sample sizes (bootstrapped range of mean gene diversity: 0.585–0.632, range of mean allelic richness: 5.00–5.37).
None of the loci, nor any of the sampled colonies deviates significantly from Hardy-Weinberg equilibrium. Tests for a very recent bottleneck, as assessed by statistics looking for heterozygote excess, detect no evidence for a bottleneck neither under the SMM nor under the TPM (W.-test one-sided: p = 1.00).
Discussion
Taxonomic status of the genus Zalophus
It was one goal of this study to address taxonomic relationships within the genus Zalophus in order to better delineate conservation units of interest. Despite of all difficulties with the species concept as such [22], to our understanding we can build a case for classifying the JSL, the GSL and the CSL as true species relative to the taxonomic practice in the entire group of the eared seals (Otariidae).Japanese sea lion
Several phylogenetic reconstruction methods support monophyly for the JSL with no apparent signs of reticulation with other taxa. Our results are in line with other studies that claimed species status for the JSL based on morphological data [23,24]. As to our knowledge there is no conflicting evidence for this, we suggest to consider species status for the JSL as the null hypotheses for further studies and recommend calling it Zalophus japonicus hereafter.Californian sea lion and Galápagos sea lion
It also seems justified to reinstall species status for the GSL, as originally proposed by Sivertsen [11]. This is supported by several lines of evidence.
1) Bayesian approaches suggest reciprocal monophyly for the sister taxa (genealogical species concept). Although the amount of mtDNA divergence between the GSL and the CSL is low, it lies within the range of well established otariid species [15].
2) Molecular time estimates place the time to common ancestry at about 2.5 mya. This degree of historical isolation is not uncommonly small among pinniped species [16].
3) Ten diagnostic markers in the mitochondrial as well as one marker in the nuclear genome show that unequivocal assignment into distinct taxonomic units is possible (diagnostic species concept).
4) Evidence of clear separation between the GSL and the CSL is bolstered by population genetic analysis on the basis of microsatellite markers. Private alleles are found for nearly all loci in both taxa. While the high number of private alleles detected in the GSL could be considered as an artefact of low sample sizes in the CSL, the reverse is clearly not the case. Unique alleles found for the GSL can be regarded as real, since more than 1200 individuals from all over the Galápagos archipelago are very likely to reflect the full allelic inventory of the population. What is more, allele size distributions are often bimodal where each peak reflects one taxon. This further indicates that private alleles are more than occasional sampling dropouts. Moreover, bimodality in allele sizes also explains that Rst estimates are almost twice as high than estimates for Fst. Both estimates of genetic differentiation, as well as the assignment test point towards complete reproductive isolation (strict allopatry, biological species concept). Even if casual observations of long-distance migrants are considered, CSL and GSL ranges do not overlap [10]. This is not astounding, as populations of the CSL and the GSL are isolated by vast expanses of unproductive tropical waters.
In summary, analysis of mitochondrial and nuclear DNA suggests that the GSL and the CSL are two distinct genetic entities that deserve species status. This evidence is partly supported by behavioural studies [25,26], but contrasts with recent analyses based on morphological discrimination where a few outliers do not perfectly cluster in their group [23]. Cranial morphometric characters may thus not reflect the rapid divergence on the molecular level in the two species under study, or may be subject to convergent plasticity effects.
Conservation management
It is widely believed that "bad taxonomy can kill", i.e. that an accurate taxonomic delineation of conservation units is of critical importance in conservation biology [27]. However, for a species that already is protected in its core range, is there anything to be gained by clarification of its taxonomic status beyond mere scientific interest? Conservation problems in the Galápagos have seriously increased with dramatically increased tourism and immigration into the archipelago over the last 10 years. Plans of long-line and drift net fishing even within the protected zone have recently been discussed seriously. Thus, the finding that the GSL constitutes a genetically unique population strengthens the position of the Galápagos National Park to argue against aggressive exploitation of the marine reserve. But even more importantly, our findings show very clearly that in case of drastic population decline, no recruitment can be expected from populations outside the Galápagos archipelago. If the GSL disappears from the Galápagos Islands it is lost worldwide.
The amount of genetic diversity is another issue of concern in conservation biology. Gene diversity in the GSL is only about 14% lower than in the CSL, but this estimate is conservative for three reasons. 1) The real diversity of the CSL is expected to be higher, as our samples were only derived from a single area (Monterey), whereas samples of the GSL cover its entire distribution. 2) Samples sizes were considerably lower in the CSL and 3) there is an ascertainment bias as the majority of microsatellites were developed for the GSL. The lower degree of genetic diversity is not due to a single recent severe El Niño event, as we found no evidence for recent bottlenecks. Instead, it is more likely a reflection of repeated bottlenecks which would lead to a generally reduced effective population size as has been suggested for the Galápagos Penguin [28]. This explanation also fits with the overall lower mitochondrial diversity of the GSL compared to the CSL (Fig. 2, 3). The lowered genetic diversity in the GSL relative to the CSL may be of concern, as reduced lowered genetic diversity can negatively affect resilience to environmental challenges and can correlate with increased disease susceptibility [29]. Taking into account that sea lion colonies partly overlap with ever growing human settlements and sea lions virtually come into people's houses and physically interact with humans and dogs, an immediate threat to a population with low genetic diversity is not a far-fetched scenario. This danger is particularly acute, as distemper virus and possibly also rabies (non-confirmed case in Isabela) that are known to ravage pinniped populations have been documented in dogs (M. Cruz, S. J. Goodman, A. A. Cunningham, personal communication). Management decisions reinforcing the separation between humans, feral or domestic carnivores and sea lions are urgently needed. Even vaccination programs on the dog population in proximity to sea lion colonies as e.g. in San Cristobal, Santa Cruz and Isabela might be advisable.
Conclusion
Based on molecular evidence we suggest treating the Galápagos sea lion, the Californian sea lion and the Japanese sea lion by the name of species Zalophus wollebaeki and Zalophus californianus and Zalophus japonicus, respectively. We point out that -contrary to recent practice – all three species should be included in future studies on pinniped phylogeny. The strong divergence within the Californian sea lion further calls for a diligent analysis of the Californian clade [see also [30]].Regarding conservation of the Galápagos sea lion we deem the general protection provided by the Galápagos National Park highly warranted. Moreover, given its small geographical range, the variable ecological conditions in its marine habitat and increasing human-induced pressure, we recommend devising more specific conservation management plans for this vulnerable species.
Methods
Laboratory procedures and data analyses of molecular markers
Sample collection and DNA extraction
GSL: A total of 376 skin samples were collected from the interdigital membrane of the hind flippers of pups (< 3 months of age) at their natal rookeries and stored in 70 % ethanol. Sampling locations were uniformly spread across the Galápagos archipelago except the northernmost islands of Darwin and Wolf. Genomic DNA was extracted with the DNeasy® tissue kit (Qiagen ™) and stored in Tris-EDTA buffer.
CSL: DNA samples of the CSL were supplied from locations of the Pacific Coast (Monterey Bay) central to the taxon's range containing adults (n = 5) as well as sub-adult individuals (n = 11).
The striking disproportion in sample sizes is taken into account in the subsequent analysis of microsatellite data and discussed in more detail later on. The analysis of mtDNA data is not affected since we here use only a small subset of the GSL-samples.
Mitochondrial DNA
Part of the mitochondrial control region (625 bp) and the cytochrome b gene (500 bp) were amplified in both taxa by use of PCR with primers that were constructed on the basis of conserved regions of several mitochondrial pinniped genomes [see e.g. [16]]. After purification by ultrafiltration (Machery Nagel) PCR-products were sequenced on an ABI 3730 sequencer employing the Bigdye® Terminator 3.1 cycle sequencing Kit (Applied Biosystems). A total of ten specimens of the GSL (control region: AM422165–AM422174, cytb: AM422143–AM422152) and twelve of the CSL (control region: AM422175–AM422186, cytb: AM422153–AM422164) were sequenced (see Table 3). Quality ascertainment and sequence alignment were conducted using SeqMan™ 6.1. (DNAStar Inc.). Alignments were evaluated by eye and corrected where required.
Table 3. Sampling locations and sample sizes. Locations of sampled rookeries, geographical coordinates and number of samples for the analysis of mitochondrial and nuclear DNA.
In a first step, we evaluated sister group status in a phylogenetic context including all eared seals (Otariidae). We used the sequence set from Wynen et al. [15] for both the cytochrome b gene and the control region and included a randomly chosen subset of six specimens for the GSL and six specimens for the CSL. The final alignment of the concatenated sequences of both markers consisted of 59 individuals from 16 taxa. The two phocid species Halichoerus grypus and Phoca vitulina, on which the phylogenetic tree was rooted, showed considerable longer sequences in the control region (335 bp) than the otariid seals (276 to 293 bp). No variation in sequence length was observed for the cytochrome b sequence (360 bp). Within the otariids a 24 bp region of the mitochondrial control region (bp 116–140) showed indels in basically all individuals. Sequences were arranged manually such that the number of nucleotide substitutions was minimized. Otherwise the alignment was unambiguous, several large deletions in the otariids compared to the phocid sequences could unequivocally be aligned. Final alignment length was 700 bp including gaps and 617 bp excluding gaps, respectively.
For phylogenetic reconstruction we applied maximum parsimony and Bayesian approaches. Maximum parsimony analysis was carried out in MEGA 3.1 [31] with the following settings: unweighted parsimony, close-neighbour interchange heuristic search with 500 random initial trees, including gaps as fifth character. Alignment gaps that exclusively related to the outgroup taxa were removed prior to the analysis. Confidence limits on interior branches in MP phylogeny reconstruction were estimated using bootstrap resampling with 5000 replicates [32]. Bayesian analysis was performed using MrBayes 3.1.2. [33]. To account for differential nucleotide substitution rates we partitioned the dataset (control region and codon-specific subsets of the cytochrome b gene) and chose the most complex evolutionary model of substitution rate and among-site rate variation as a starting point (GTR +Γ+I). As the more parsimonious HKY model was slightly less supported (Bayes factor comparisons), and the analysis in MrBayes is rather robust to over-paramatrization, we here report the outcome of the complex model. Results obtained from the HKY model yielded the same results. The program was run twice with four simultaneous chains and two simultaneous runs for one million generations, every 103 of which a tree was sampled. The first 50*103 MCMC steps were discarded as burn-in after which convergence of the Markov chains had long been reached. 1900 remaining trees of the two runs with highest harmonic mean likelihood were used to construct a 50% majority rule consensus.
Within the order of pinnipeds there is evidence for molecular clock-like sequence evolution [15,34], which was confirmed by Tajima's relative rate test on the two taxa in question [35] using the Steller sea lion (Eumetopias jubatus) as the outgroup. Molecular clock estimates were based on the work by Arnason and coworkers [16], who place the basal Phocina split at 4.5 mya. We used one member of each Phocina clade, Phoca vitulina and Halichoerus grypus, as our calibration point with a minimum divergence time of 4.5 mya. This estimate is better supported than the often used 'Phoca standard' [34], which assumed 2.7 mya for the Phocina split (Arnason, personal communication). Molecular distances are based on the Bayesian consensus tree and correspond to mean branch lengths of the posterior distribution. Error in divergence estimates stemming from branch length uncertainty were derived as follows: As shorter genetic distances are associated with a higher proportionate error, a calibration curve was built to adequately describe this relation and finally to predict the error associated with a given branch length. We fitted a 2nd degree polynomial regression on branch length and its proportionate standard deviation in R [36] and used the predicted regression curve for calibration.
In a second step, the genus Zalophus including the GSL, the CLS and the JSL was examined in more detail. As populations of the CSL are known to diverge, a broader sampling across the taxon's range is desirable. To this end we used published sequences from Maldonado et al. [30] of the mitochondrial control region from populations further South of the Pacific Coast (Channel Islands) and from the Gulf of California. Sequences for the mitochondrial control region isolated from ancient DNA of the JSL have also just become available [37]. A detailed list of sampling locations and respective sample sizes is given in Table 3. The phylogenetic analysis had to be restricted to an alignment including 301 bp of the mitochondrial control region, as the cytochrome b information of the published CSL sequences was of bad quality, and none was available for the JSL. A phylogenetic tree rooted by the Steller sea lion was constructed with the Bayesian approach described above (using HKY as the best model of nucleotide substitution). To investigate possible reticulations between taxa, we constructed a median-joining network [38] and a distance based Neighbour-Net network [39] using the software SplitsTree4 [40]. The patterns obtained by these methods were very robust to different substitution models and were highly repeatable across other network based approaches.
Microsatellites
Genomic DNA was genotyped for a total of 367 GSL and 16 CSL at 25 fluorescently labelled dinucleotide microsatellite loci using the Qiagen® multiplex PCR Kit. To get an accurate idea on the allelic inventory of the GSL population, another 853 samples were included exclusively for the estimation of the number of private alleles (for details see Table 1). These samples stem from an ongoing behavioural study on the central islet of Caamaño [13,41,42]. Three loci (ZcwG06, Hg63, ZcCgDh4.7) deviated from Hardy-Weinberg-equilibrium (null alleles) in most of the sampled Galápagos rookeries and were excluded from the analysis. The programs STRUCTURE 2.1. [43] and BAPS 4.13. [44] were used to quantify the degree to which individuals cluster within the same taxon. Default settings were used for individual clustering in BAPS 4.13, run parameters for analysis in STRUCTURE were as follows: 10 independent runs using correlated allele frequencies and no admixture as ancestry model, burn in length 6*105 and 106 MCMC steps. Two clusters explained the data considerably better than assuming one panmictic population of both taxa (ln(P|D)K = 1:-23387.7 ± 0.025SE; ln(P|D)K = 2:-22416.1 ± 3.74SE). Structural properties within the Galápagos population are small and of no further interest in the context of this study and will be described elsewhere (Wolf et al., in prep.). Conventional Fst estimates [θ [45]] and the Rst estimate following Rousset [46] were used to estimate the degree of genetic differentiation between the sister taxa using Fstat 2.9.3.2. [47]. Standardized pairwise Rst distances [48] were obtained from the software Microsat 1.5d [49] and used for cluster-based tree reconstruction in the Phylip module Neighbor [50]. The G statistic proposed by Goudet [51] was used for statistical inference on population differentiation. As sample sizes markedly differed between compared populations (see above) we explicitly chose an Fst estimators that is presumably independent of sample size [45]. As sample sizes were extremely skewed, we examined the effect by random sub-sampling nonetheless. We created ten random sub-samples of 20 genotypes each from the GSL and ran the analyses again. Summary statistics are reported as means and standard errors.
Microsatellite allele frequency data were further used to uncover, whether the GSL population underwent a recent bottleneck event. We estimated gene diversity and allelic richness separately for each locus using rarefaction estimates implemented in Fstat that standardize for differing sample sizes. Differences between taxa in the two measures were assessed using Wilcoxon's matched-pairs-signed-rank tests as implemented in R [36]. We further used the software Bottleneck 1.2.02. [52], which makes use of the fact that in populations, which have experienced a recent reduction in their effective population size, number of alleles drop quicker than gene diversity. Such populations will show an unexpected high degree of gene diversity, if compared to the expected equilibrium gene diversity computed from the number of alleles [53]. The relation of observed and expected gene diversity depends on the assumed mutation model of the marker. As neutral microsatellite markers are thought to follow a stepwise mutation model (SSM) rather than an infinite allele model, we performed the analysis under the assumption of stepwise mutation and under a two phased model (TPM), which allows 10% of multi-step mutations, as recommended by the program's authors.
Single nucleotide polymorphism
We further screened the nuclear genome for single nucleotide polymorphisms pursuing two different approaches. First, we used microsatellite clones that have specifically been developed for the GSL [for cloning procedure see [54]] including 'false positive clones' of this screen with genomic inserts devoid of microsatellite stretches. Second, we designed primers in exon regions of the dog genome (Canis familiaris) closing around intron sequences of appropriate size (700–850 bp). A SNP-pool detection approach was used to search for fixed differences between populations [55]. All sequencing reactions were performed on pools of DNA from each taxon including equal amounts of DNA from 11 specimens each. Sequencing was conducted as specified above. This direct sequencing of pooled DNA will somewhat underestimate rare alleles. In artificial mixing experiments we found that alleles at a frequency of 10% can still be detected, but alleles below 5% may be missed (Staubach and Tautz, unpublished). Loci, primers, expected size, length of reliable sequence and GenBank/ENSEMBL accession number are reported in Table 2.
Authors' contributions
JBWW conceived of the study, collected most samples together with FT (see also acknowledgments), conducted the laboratory analyses, performed the phylogentic and other statistical analyses and wrote the manuscript. DT and FT contributed substantially to the content of the manuscript in their respective area of expertise and helped drafting the manuscript. All authors read and approved the final manuscript.
Acknowledgements
We gratefully acknowledge assistance in the field provided by Corinne Zurbrügg, Karina Acevedo-Whitehouse, Marilyn Cruz, Sandie Salazar and Simon J. Goodman. Samples of the Californian sea lion were kindly provided by Terry Williams. We thank David Aurioles-Gamboa and S. Salazar, who contributed samples for the easternmost range of the Galápagos sea lion. Thanks to Till Bayer for writing a script finding adequate sequences of dog genome, to Ulrich Pörschmann and Edda Geißler for helping with the figures and to Elke Hippauf for help in the lab. The manuscript has certainly gained from useful comments by Arne Nolte, Patrick Kück and Sylvia Brunner. We would also like to thank the Max-Planck Society via the Institute for Ornithology, Seewiesen, for use of their research table. Funding was provided by the National Geographic Society (grant: 7671-04), Volkswagen Stiftung and the German Research Foundation (WO 1426/1-1). The study complied with the laws of Ecuador, and was carried out under permit and with support of the Servicio Parque Nacional Galápagos and the Charles Darwin Research Station.
References
Crandall KA, Bininda-Emonds ORP, Mace GM, Wayne RK: Considering evolutionary processes in conservation biology.
Trends Ecol Evol 2000, 15:290-295. PubMed Abstract | Publisher Full Text
Return to text
Trillmich F, Dellinger T: The Effects of El Niño on Galapagos Pinnipeds.
Ecological Studies – Pinnipeds and El Niño 1991, 88:66-74.
Return to text
Salazar S, Edgar G: Galapagos sea lion massacre.
Mar Poll Bull 2001, 42:705-705.
Return to text
Danulat E, Edgar GJ:
Reserva Marina de Galápagos. Puerto Ayora, Santa Cruz, Galápagos: Fundación Charles Darwin/Servicio Parque Nacional Galápagos;. 2002.
Return to text
Lévèque R: Le statut actuel des vertebres rares et menaces de l'archipel des Galapagos.
La Terre et la Vie 1963, 110:397-437.
Return to text
Trillmich F: Galápagos sea lions and fur seals.
Noticias de Galápagos 1979, 29:8-14.
Return to text
Salazar SK: Dieta, tamaño poblacional e interacción con desechos costeros del lobo marino Zalophus californianus wollebaeki en las islas Galápagos. Disertación previa al título de Licenciatura en Ciencias Biológicas. Pontificia Universidad Católica del Ecuador; 1999.
Return to text
IUCN: 2004 IUCN Red List of Threatened Species. [http://www.iucnredlist.org] webcite
2004.
Return to text
Carretta JV, Forney KA, Muto MM, Barlow J, Baker J, Hanson B, Lowry MS: US Marine Mammal Stock Assessments. [http:/ / swfsc.noaa.gov/ uploadedFiles/ Species/ Marine_Mammals/ Sea_Lions/ SWFSC_TM_375_2004_PacSARS_Final.pdf] webcite
NOAA-TM-NMFS-SWFSC-375 2005, 1-7.
Return to text
Heath CB: California, Galapagos, and Japanese Sea Lions. In Encyclopedia of Marine Mammals. Edited by: Perrin WF, Würsig B, Thewissen JGM. New York: Academic Press; 2002.
Return to text
Sivertsen E: A new species of sea lion, Zalophus wollebaeki, from the Galapagos Islands.
K Norske Vidensk Selsk Forh 1953, 26:1-3.
Return to text
Scheffer VB: Seals, Sea Lions and Walruses: A Review of the Pinnipedia. Stanford California: Stanford University Press; 1958.
Return to text
Wolf JBW, Kauermann G, Trillmich F: Males in the shade: habitat use and sexual segregation in the Galápagos sea lion (Zalophus californianus wollebaeki).
Behav Ecol Sociobiol 2005, 59:293-302. Publisher Full Text
Return to text
Salazar S, Bustamante RH: Effects of the 1997–1998 El Niño on population size and diet of the Galápagos sea lion (Zalophus wollebaeki.
Noticias de Galápagos 2003, 62:40-45.
Return to text
Wynen LP, Goldsworthy SD, Insley SJ, Adams M, Bickham JW, Francis J, Gallo JP, Hoelzel AR, Majluf P, White RWG, Slade R: Phylogenetic Relationships within the Eared Seals (Otariidae: Carnivora): Implications for the Historical Biogeography of the Family.
Mol Phylogenet Evol 2001, 21:270-284. PubMed Abstract | Publisher Full Text
Return to text
Arnason U, Gullberg A, Janke A, Kullberg M, Lehman N, Petrov EA, Väinölä R: Pinniped phylogeny and a new hypotheses for their origin and dispersal.
Mol Phylogenet Evol 2006, 41:345-354. PubMed Abstract | Publisher Full Text
Return to text
Berta A, Sumich JL, Kovacs KM: Marine Mammals. Evolutionary Biology. San Diego, California: Academic Press; 2006.
Return to text
Riedmann M: The Pinnipeds. Seals, Sea Lions, and Walruses. Berkeley/Los Angeles: University of California Press; 1990.
Return to text
Reynolds JE III, Rommel SA: Biology of Marine Mammals. Washington: Smithsonian Institution Press; 1999.
Return to text
Rice DW: Marine Mammals of the World. Systematics and Distribution. Special Publication Number 4. Lawrence KS, USA: The Society for Marine Mammology; 1998.
Return to text
Hey J, Waples RS, Arnold ML, Butlin RK, Harrison RG: Understanding and confronting species uncertainty in biology and conservation.
Trends Ecol Evol 2003, 18:597-603. Publisher Full Text
Return to text
Hey J: On the failure of modern species concepts.
Trends Ecol Evol 2006, 21:447-450. PubMed Abstract | Publisher Full Text
Return to text
Brunner S: Fur seals and sea lions (Otariidae): identification of species and taxonomic review.
Syst Biodivers 2003, 1:339-439. Publisher Full Text
Return to text
Itoo T: New cranial material of the Japanese sea lion, Zalophus californianus japonicus (Peters, 1866).
J Mamm Soc Jpn 1985, 10:135-148.
Return to text
Eibl-Eibesfeldt I: Ethologische Studien am Galapagos-Seelöwen, Zalophus wollebaeki (Sivertsen).
Z Tierpsychol 1955, 12:286-303.
Return to text
Eibl-Eibesfeldt I: The Galápagos seals part 1. Natural history of the Galápagos Sea Lion (Zalophus californianus wollebaeki, Sivertsen). In Key environments – Galápagos. Edited by: Perry R. Oxford: Pergamon Press; 1984:207-214.
Return to text
May RM: Taxonomy as destiny.
Nature 1990, 347:129-130. Publisher Full Text
Return to text
Akst EP, Boersma DP, Fleischer RC: A comparison of genetic divdersity between the Galápagos Penguin and the Magellanic Penguin.
Conserv Genet 2002, 3:375-383. Publisher Full Text
Return to text
Acevedo-Whitehouse K, Gulland F, Greig D, Amos W: Disease susceptibility in California sea lions.
Nature 2003, 422:35. PubMed Abstract | Publisher Full Text
Return to text
Maldonado JE, Davila FO, Stewart BS, Geffen E, Wayne RK: Intraspecific genetic differentiation in California sea lions (Zalophus californianus) from Southern California and the Gulf of California.
Mar Mamm Sci 1995, 11:46-58. Publisher Full Text
Return to text
Kumar S, Tamura K, Nei M: MEGA3: Integrated software for molecular evolutionary genetics analysis and sequence alignment.
Brief Bioinform 2004, 5:150-163. PubMed Abstract | Publisher Full Text
Return to text
Felsenstein J: Confidence limits on phylogenies: An approach using the bootstrap.
Evolution 1985, 39:783-791. Publisher Full Text
Return to text
Ronquist F, Huelsenbeck JP: MrBayes 3: Bayesian phylogenetic inference under mixed models.
Bioinformatics 2003, 19:1572-1574. PubMed Abstract | Publisher Full Text
Return to text
Arnason U, Xu X, Gullberg A, Graur D: The "Phoca standard": an external molecular reference for calibrating recent evolutionary divergences.
J Mol Evol 1996, 43:41-45. PubMed Abstract | Publisher Full Text
Return to text
Tajima F: Simple methods for testing molecular clock hypothesis.
Genetics 1993, 135:599-607. PubMed Abstract | Publisher Full Text | PubMed Central Full Text
Return to text
R Development Core Team: R: A language and environment for statistical computing. Vienna, Austria: R Foundation for Statistical Computing; 2006.
Return to text
Sakahira F, Niimi M: Ancient DNA Analysis of the Japanese Sea Lion (Zalophus japonicus japonicus Peters, 1866): Preliminary results using mitochondrial control-region sequences.
Zool Sci 2007, 24:81-85. PubMed Abstract | Publisher Full Text
Return to text
Bandelt H-J, Forster P, Röhl A: Median-joining networks for inferring intraspecific phylogenies.
Mol Biol Evol 1999, 16:37-48. PubMed Abstract | Publisher Full Text
Return to text
Bryant D, Moulton V: Neighbor-Net: an agglomerative method for the construction of phylogenetic networks.
Mol Biol Evol 2004, 21:255-265. PubMed Abstract | Publisher Full Text
Return to text
Huson DH, Bryant D: Application of Phylogenetic Networks in Evolutionary Studies.
Mol Biol Evol 2006, 23:254-267. PubMed Abstract | Publisher Full Text
Return to text
Wolf JBW, Trillmich F: Beyond habitat requirements: individual fine-scale site fidelity in a colony of the Galapagos sea lion (Zalophus wollebaeki) creates conditions for social structuring.
Oecologia 2007, 152:553-567. PubMed Abstract | Publisher Full Text
Return to text
Trillmich F, Wolf JBW: Parent-offspring and sibling conflict in Galápagos fur seals and sea lions.
Behav Ecol Sociobiol, in press.
DOI 10.1007/s00265-00007-00423-00261
Return to text
Falush D, Stephens M, Pritchard JK: Inference of population structure using multilocus genotype data: Linked loci and correlated allele frequencies.
Genetics 2003, 164:1567-1587. PubMed Abstract | Publisher Full Text | PubMed Central Full Text
Return to text
Corander J, Waldmann P, Sillanpaa MJ: Bayesian analysis of genetic differentiation between populations.
Genetics 2003, 163:367-374. PubMed Abstract | Publisher Full Text | PubMed Central Full Text
Return to text
Weir BS, Cockerham CC: Estimating F-statistics for the analysis of population structure.
Evolution 1984, 38:1358-1370. Publisher Full Text
Return to text
Rousset F: Equilibrium values of measures of population subdivision for stepwise mutation processes.
Genetics 1996, 142:1357-1362. PubMed Abstract | Publisher Full Text | PubMed Central Full Text
Return to text
Goudet J: FSTAT: a program to estimate and test gene diversities and fixation indices (version 2.9.3). [http://www2.unil.ch/popgen/softwares/fstat.htm] webcite
2001.
Return to text
Goodman SJ: R-ST Calc: a collection of computer programs for calculating estimates of genetic differentiation from microsatellite data and determining their significance.
Mol Ecol 1997, 6:881-885. Publisher Full Text
Return to text
Minch E, Ruiz-Linares A, Goldstein DB, Feldman M, Cavalli-Sforza LL: Microsat (version 1.5d): a program for calculating various statistics on microsatellite allele data. Stanford, CA: Stanford University; 1995-1997.
Return to text
Felsenstein J: PHYLIP (Phylogeny Inference Package) version 3.6.
Distributed by the authorDepartment of Genome Sciences, University of Washington, Seattle 2004.
Return to text
Goudet J, Raymond M, De Meeüs T, Rousset F: Testing differentiation in diploid populations.
Genetics 1996, 144:1933-1949. PubMed Abstract | Publisher Full Text | PubMed Central Full Text
Return to text
Piry S, Luikart G, Cornuet JM: BOTTLENECK: A computer program for detecting recent reductions in the effective population size using allele frequency data.
J Hered 1999, 90:502-503. Publisher Full Text
Return to text
Cornuet JM, Luikart G: Description and power analysis of two tests for detecting recent population bottlenecks from allele frequency data.
Genetics 1996, 144:2001-2014. PubMed Abstract | Publisher Full Text | PubMed Central Full Text
Return to text
Wolf JBW, Tautz D, Caccone A, Steinfartz S: Development of new microsatellite loci and evaluation of loci from other pinniped species for the Galápagos sea lion (Zalophus californianus wollebaeki).
Conserv Genet 2006, 7:461-465. Publisher Full Text
Return to text
Kwok PY, Carlson C, Yager TD, Ankener W, Nickerson DA: Comparative analysis of Human DNA variations by fluorescence based sequencing of PCR products.
Genomics 1994, 23:138-144. PubMed Abstract | Publisher Full Text
Return to text
Hoffman JI, Steinfartz S, Wolf JBW: Ten novel dinucleotide microsatellite loci cloned from the Galápagos sea lion (Zalophus californianus wollebaeki) are polymorphic in other pinniped species.
Mol Ecol Notes 2007, 7:103-105. Publisher Full Text
Return to text
Hernandez-Velazquez FD, Galindo-Sanchez CE, Taylor MI, de la Rosa-Velez J, Cote IM, Schramm Y, Aurioles-Gamboa D, Rico C: New polymorphic microsatellite markers for California sea lions (Zalophus californianus).
Mol Ecol Notes 2005, 5:140-142. Publisher Full Text
Return to text
Allen PJ, Amos W, Pomeroy PP, Twiss SD: Microsatellite variation in grey seals (Halichoerus grypus) shows evidence of genetic differentiation between two British breeding colonies.
Mol Ecol 1995, 4:653-662. PubMed Abstract
Return to text
Goodman SJ: Dinucleotide repeat polymorphisms at seven anonymous microsatellite loci cloned from the European Harbour Seal (Phoca vitulina vitulina).
Anim Genet 1997, 28:310-311. PubMed Abstract
Return to text
www.frontiersinzoology.com/content/4/1/20


